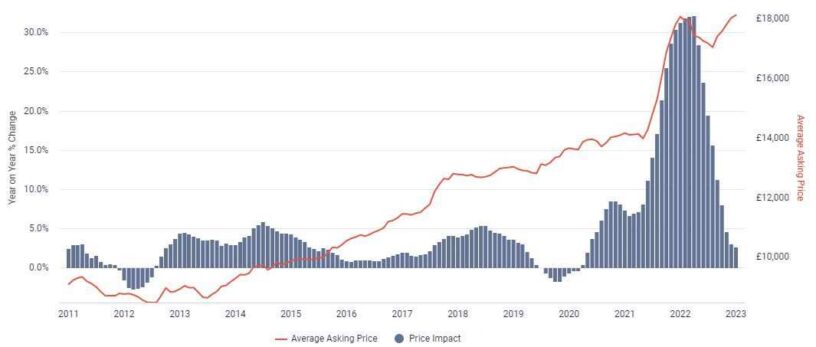


According to the latest data from the Auto Trader Retail Price Index, which is based on daily pricing analysis of circa 900,000 vehicles across the retail market, the average retail price of a used car was £18,119 in January. It marks a 2.7% year-on-year (YoY) increase on a like-for-like basis, and the 34th month of consecutive price growth.
Although the rate of YoY pricing growth is continuing to slow (now at the lowest rate since exiting Covid lockdown in May 2020[1]), it builds on the massive 31.3% recorded in January last year and highlights the continuing robustness of the market. And highlighting just how steeply and quickly average used car values have climbed, the average price in May 2020 was a comparatively low £13,931; over £4,000 less than average values today. Following the seasonal slowdown over the festive period, January also saw average prices increase on a month-on-month basis, rising 0.2% on December.
The current stability in used car prices continues to be driven by the combination of robust consumer demand, and the ongoing squeeze in supply. This is reflected in Auto Trader’s marketplace data, which shows that whilst the volume of cross platform visits increased 14% last month against January 2022 (the third consecutive month of YoY growth), while supply[2] fell by -5% over the same period.
Demand for older stock sends prices skywards
A good indicator of market health is the speed in which used cars are leaving retailers’ forecourts. Auto Trader’s data shows that used cars took an average of 40 days to sell in January, which is just one day slower than last year (39), but faster than pre-pandemic averages[3]. On average older cars were leaving forecourts the fastest in January, with those aged 10-15 years taking just 35 days, whilst 5–10-year-old-cars took a similarly above market average of 36. The slowest age cohort to sell, however, was 1-3-year-old-cars, which took an average of 47 days.
Looking at the pricing data at a more granular level, the growing demand for older and cheaper stock is not only resulting in a faster speed of sale for older age cohorts, but also stronger levels of price growth. Those cars aged 10-15 years old (which had an average value of £6,325 last month) increased 0.5% between December and January, and on a year-on-year basis, were up a whopping 10.9%. Younger cars, however, have followed a trajectory more aligned to the broader retail market, with those aged up to a year-old (£36,640) increasing 0.2% MoM. 1-3-year-old cars (£28,019) dropped -0.3%.
Used ICE prices heat up as EV’s continue to cool
As a result of a dramatic acceleration in levels of electric vehicle (EV) supply (surging from just 2% of all used cars advertised on Auto Trader in June, to over 6% in January) past consumer demand which has been flattened recently by rising energy prices, used EV retail values recorded the fifth consecutive MoM decline in January, dropping -2.1% from December to £36,179. Year-on-year, average electric values have fallen -1.5%. It’s in contrast to its petrol and diesel counterparts, which both outperformed the wider market at a MoM level; the average values of a used petrol (£16,557) and diesel (£16,650) car increased 0.6% and 0.4% respectively between December and January. Petrol was up 3.4% YoY and diesel was up 2.5%.
To help correct this trend, and to avoid more than just a small pothole on the road to 2030, more action will be required from both the government and industry. The used EV market will play a vital role in driving mass adoption of electric cars, and unless more consumers are prepared to take a risk with second-hand alternatives, new EV targets will be harder to achieve i.e. if retailers lose confidence in their used stock, new models will become increasingly difficult to sell. Encouraging car buyers into used EVs through incentives, marketing, and education to demystify them (including helping to correct myths around battery degradation and reliability) will be critical.
Uptick in consumer confidence points to used car stability in 2023
Despite the uncertain economic and political back drop, consumer confidence continues to show signs of improvement. In fact, both the YouGov[4] and GFK[5] consumer confidence trackers reported an uptick in December. This is reflected in Auto Trader’s own consumer research, which shows that more than three quarters (78%) of the circa 1,900 in-market car buyers surveyed in January are planning on buying in the next six months, and 27% in the next three months. What’s more, over 80% of visitors to Auto Trader’s platforms are at least as confident as they were at this time last year in being able to afford their next car. This percentage has stayed strong for UK car buyers on Auto Trader over the last six months.
Commenting on the data, Auto Trader’s Director of Data and Insight, Richard Walker, said: “It’s hard to ignore the current political and economic disruption, but based on what we’re tracking, it’s having a very limited impact on the retail market. Crucially, demand for used cars remains robust, which along with the ongoing constraints in supply, is keeping prices stable, and with it, profits healthy. However, as our data highlights, the market is incredibly nuanced, and fluctuations in supply or demand can have an impact at a very granular level. It’s critical then, that retailers follow the data carefully to ensure the very best possible margin.”
Sue Robinson, Chief Executive of the National Franchised Dealers Association (NFDA), added: “The used car market has entered 2023 with continued resilience, values have remained stable, and demand is buoyant. Franchised and independent dealers selling used car vehicles are looking to the year ahead with optimism after successful trading in January, and there’s little to suggest that there will be any drastic changes to the market any time soon.”
Top 10 price growth (all fuel types) | January 2023 vs January 2022 like-for-like
| Ranks | Make | Model | Jan 23 Average Asking Price |
Price Change (YoY) |
Price Change (MoM) |
| 1 | Mercedes-Benz | S Class | £37,089 | 20.4% | 1.5% |
| 2 | Hyundai | i10 | £8,358 | 19.7% | 0.0% |
| 3 | Fiat | Panda | £5,765 | 18.7% | 1.5% |
| 4 | Fiat | Tipo | £11,591 | 18.6% | -0.6% |
| 5 | Kia | ProCeed | £15,480 | 18.4% | 0.2% |
| 6 | Toyota | Avensis | £5,825 | 17.9% | 2.7% |
| 7 | Renault | Scenic | £5,843 | 17.9% | 1.9% |
| 8 | Renault | Grand Scenic | £7,897 | 16.9% | 6.1% |
| 9 | Hyundai | ix20 | £8,979 | 16.8% | 3.1% |
| 10 | Citroen | Berlingo | £13,029 | 16.6% | 0.5% |
Top 10 price contraction (all fuel types) | January 2023 vs January 2022 like-for-like
| Rank | Make | Model | Jan 23 Average Asking Price |
Price Change (YoY) |
Price Change (MoM) |
| 10 | Suzuki | Vitara | £14,786 | -9.0% | 0.1% |
| 9 | MINI | Paceman | £9,861 | -9.1% | -2.1% |
| 8 | SKODA | Yeti | £9,893 | -9.4% | -1.0% |
| 7 | Mitsubishi | Eclipse Cross | £16,213 | -10.3% | 0.7% |
| 6 | Vauxhall | Crossland X | £12,617 | -10.3% | 0.0% |
| 5 | Hyundai | ix35 | £7,076 | -10.9% | -0.8% |
| 4 | Jaguar | XK | £20,167 | -11.1% | -1.3% |
| 3 | Land Rover | Discovery 4 | £18,300 | -11.8% | -1.5% |
| 2 | Vauxhall | Grandland X | £15,829 | -12.8% | 0.3% |
| 1 | Jaguar | I-PACE | £48,613 | -15.6% | -4.1% |
1 Average prices increased 1.9% year-on-year in May 2020
2 Determined by the volume of advertised stock on Auto Trader
3 It took an average of 42 days for a car to sell in January 2019
5 https://www.gfk.com/press/UK-Consumer-confidence-up-two-points-in-December
*Article Source www.newspress.co.uk