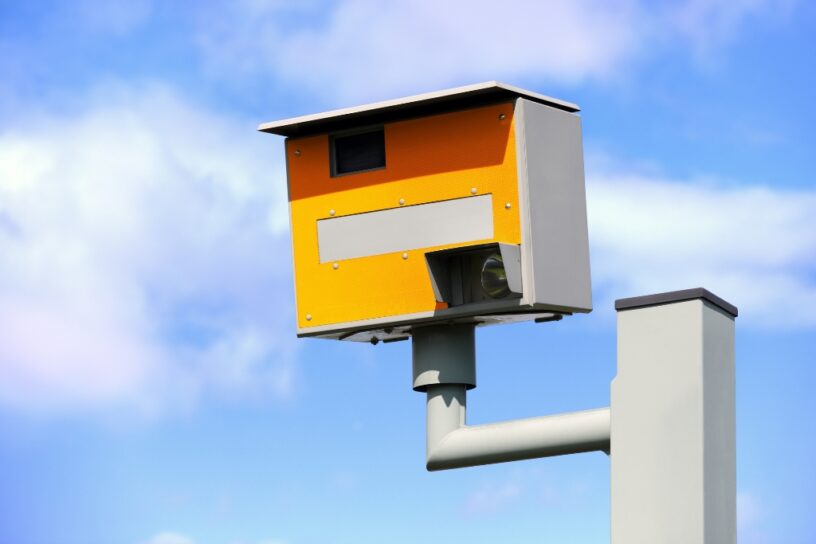
Greater London has almost 1000 speed traps located across the Capital these include red-light cameras, average speed cameras and spot speed sites, on average the Capital has 0.6 speed cameras per square Km. Derbyshire comes closely behind with 958 cameras and in tenth position Gwent with only 67 cameras. This volume of cameras in the Capital highlights either more unlawful drivers live in the Capital or perhaps the local council is using cameras as a means of raising revenue? If you also take a look at speeding data across the UK the Capital doesn’t appear in the top 10 of highest speeds captured in each region, Nottinghamshire police caught one driver at 191mph followed closely by Humberside police who clocked a driver at 163mph. Nottinghamshire has very few cameras per square Km , perhaps the volume of cameras in the Capital might actually be a deterrent?
-
Driving home for Christmas? Experts share what checks to complete before setting off
December 20, 2023
-
Drivers set to make 21m Christmas getaway trips before the big day
December 20, 2023
-
Charging home for Christmas – Lexus top tips for a festive EV charge
December 20, 2023
-
Everrati grows redefined and electrified Porsche portfolio with homage to the legendary 964 RSR
December 20, 2023
-
KAMManufaktur launches sub-700kg full-carbon 912c
December 20, 2023
Categories
- Classic car news
- Coronavirus news
- Electric & Autonomous Vehicles
- Fleet file
- General motor industry news
- Latest dealer news
- Light commercial vehicles
- Manufacturer news
- Model update
- Motorhome & Campervan News
- People on the move
- Politics and regulation
- Residual value update
- The Editor's View
- Uncategorized
Search archived articles by date
M | T | W | T | F | S | S |
---|---|---|---|---|---|---|
« Dec | ||||||
1 | 2 | 3 | 4 | 5 | ||
6 | 7 | 8 | 9 | 10 | 11 | 12 |
13 | 14 | 15 | 16 | 17 | 18 | 19 |
20 | 21 | 22 | 23 | 24 | 25 | 26 |
27 | 28 | 29 | 30 | 31 |